Crossplane
Crossplane is a CNCF project which allows defining and using any cloud API within Kubernetes as a Custom Resource. With Crossplane and the necessary dependencies installed, a developer can launch a new VM and associated resources like a VPC and an API Gateway by simply creating a custom resource. This custom resource can combine several resources in a Crossplane composite resource, so a developer only needs to reason about their high-level requirements and can defer the definition of how the VM etc. are configured to infrastructure experts. There is a growing trend to offer these definitions in a centralized location. This is often referred to as a (developer) platform.
Monitoring-As-Code
Developer platforms have many capabilities besides provisioning cloud infrastructure. Some examples are: managing environments, setting up and offering CI/CD or integrating into the local identity management. Another very prominent example is setting up monitoring. The idea is to ensure application teams have a running monitoring environment, so they start monitoring their applications from day one and include it as a standard practice. It shouldn’t come as a surprise that there are many solutions that allow to express the monitoring definition as code. Some examples are Grafana’s Grafonnet, Dynatrace’s Monaco or Datadog’s Operator. The question this post likes to explore is how we would do something similar with Crossplane:
How can we leverage Crossplane to configure monitoring?
Please note that this post assumes there is an existing monitoring infrastructure deployed somewhere, which we want to configure. This can be some custom Grafana / Prometheus deployment in some Kubernetes cluster or some cloud offering from vendors like Datadog, Dynatrace or NewRelic. This post focuses on how we would configure the existing monitoring setup with the means of Crossplane.
Why Crossplane?
I will not go into a detailed comparison to other tools at this point. For now, I would just like to reason about what we would get out of Monitoring-As-Code with Crossplane.
First, as soon as we describe our monitoring configuration as Kubernetes manifests, we can benefit from the large Kubernetes ecosystem and the many integrations. Whether it’s enforcing policies, backing up definitions or integrating into a GitOps workflow, you can be assured that the CNCF landscape has something to offer.
Another benefit is that we can now define application logic, infrastructure dependencies and monitoring dependencies as a single deployable bundle.
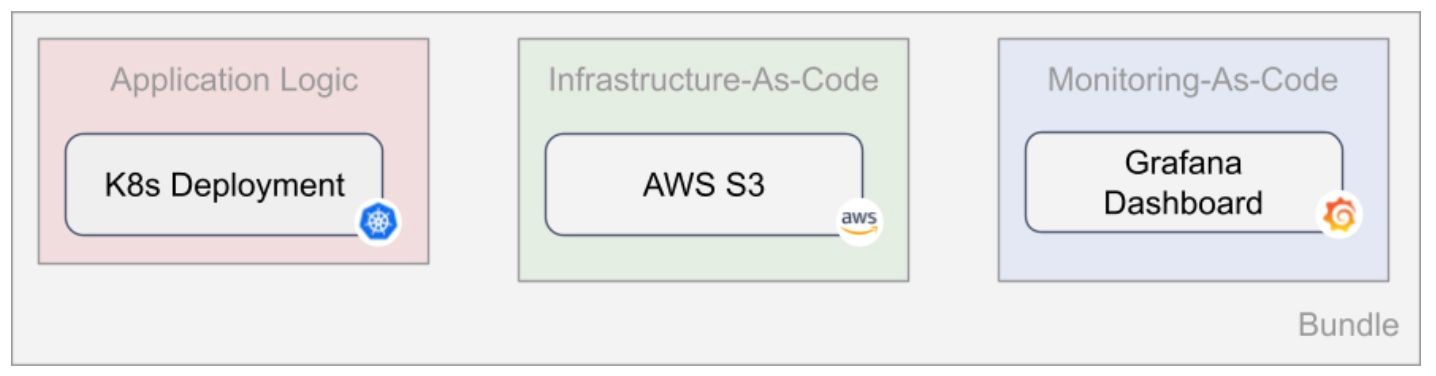
With a setup like this, we can ensure that everything works together and when we move or update applications, the infrastructure dependencies and associated monitoring definitions are also updated and possibly adapted.
But the final and most important reason is that we can leverage the Kubernetes control-plane based approach to our monitoring platform. Kubernetes can now track our monitoring definitions and ensure that the desired state matches the actual state. This becomes increasingly important as we evolve our platform and different parties are involved in defining, updating and upgrading the monitoring definitions. We need a system that different parties like the application team, the platform team and some other teams can independently update central elements of what is monitored. With Monitoring-As-Code with Crossplane, this can be achieved by leveraging Kubernetes controllers and Crossplane composite resources.
The CNCF Platforms White Paper lists five reasons of why enterprises should invest in platforms: 1) Reduce cognitive load, 2) Improve reliability and resiliency, 3) Accelerate product development, 4) Reduce risks by providing a governing structure and 5) Enable cost-effective and productive use of services. This post claims that all of these can be achieved with a Crossplane based approach, especially for monitoring.
Use-Cases
There are many use-cases and personas for whom we could apply this approach:
- The platform team offers reusable dashboards and alerting rules for application teams to use.
- Infrastructure experts build standard infrastructure dashboards and mandate application teams to keep an eye on them.
- Monitoring definitions are made of reusable components which application teams can pick and choose from.
During the authoring and review of this post, we discussed many ideas for use-cases and proper abstractions, dashboards, and ownership of the different artifacts. There are many great ideas to explore here, so we would love to hear more from the community and readers of this post on their expectations. How would you apply this approach? Are you envisioning something centrally enforced, or would you only provide golden paths? Should application teams care about the underlying infrastructure or only about application metrics?
But before we have this discussion, let's look at one concrete example and a running POC. You can find the full source code at github.com/luebken/monitoring-as-code.
Example: Dashboards for common cloud services
The use-case that I would like to explore is that the platform team wants to deploy a standard dashboard every time an application team creates new infrastructure. In Crossplane, the platform team usually creates abstractions for developers to consume. These abstractions are a way to offer a standard, and often a simplified API, for a developer to use. The implementations can differ, in their configuration (e.g. less secure in development) or in their backing services (e.g. AWS S3 for one offering and GCP Storage bucket for another).
Let’s say the platform team offers blob storage to application teams. They would start by creating an abstraction like AcmeBucket to define the API. The implementation could leverage AWS S3 and possibly restrict to a defined set of regions and ensure that ACLs are set properly. The application teams can now self-service blob storage whenever they need and include it in their processes, while the platform team can enforce certain standards. Additionally, the platform team now would also include monitoring and additionally provision a monitoring dashboard whenever the developer creates a new bucket.
The API Definition
Let’s start with the API Definition: A simple AcmeBucket, where you can only specify a name. In Crossplane, you would define the API in a CompositeResourceDefinition (XRD) with an OpenAPI Schema:
# apis/acmebuckets/definition.yaml
apiVersion: apiextensions.crossplane.io/v1
kind: CompositeResourceDefinition
metadata:
  name: xacmebuckets.storage.example.com
spec:
  group: storage.example.com
  claimNames:
    kind: AcmeBucket
    plural: acmebuckets
  versions:
  - name: v1alpha1
    schema:
      openAPIV3Schema:
		...
                properties:
                  bucketName:
                    description: The Bucket name
type: stringWhen applied to a Kubernetes Cluster with Crossplane installed, this would create a new Kubernetes resource type called AcmeBucket.
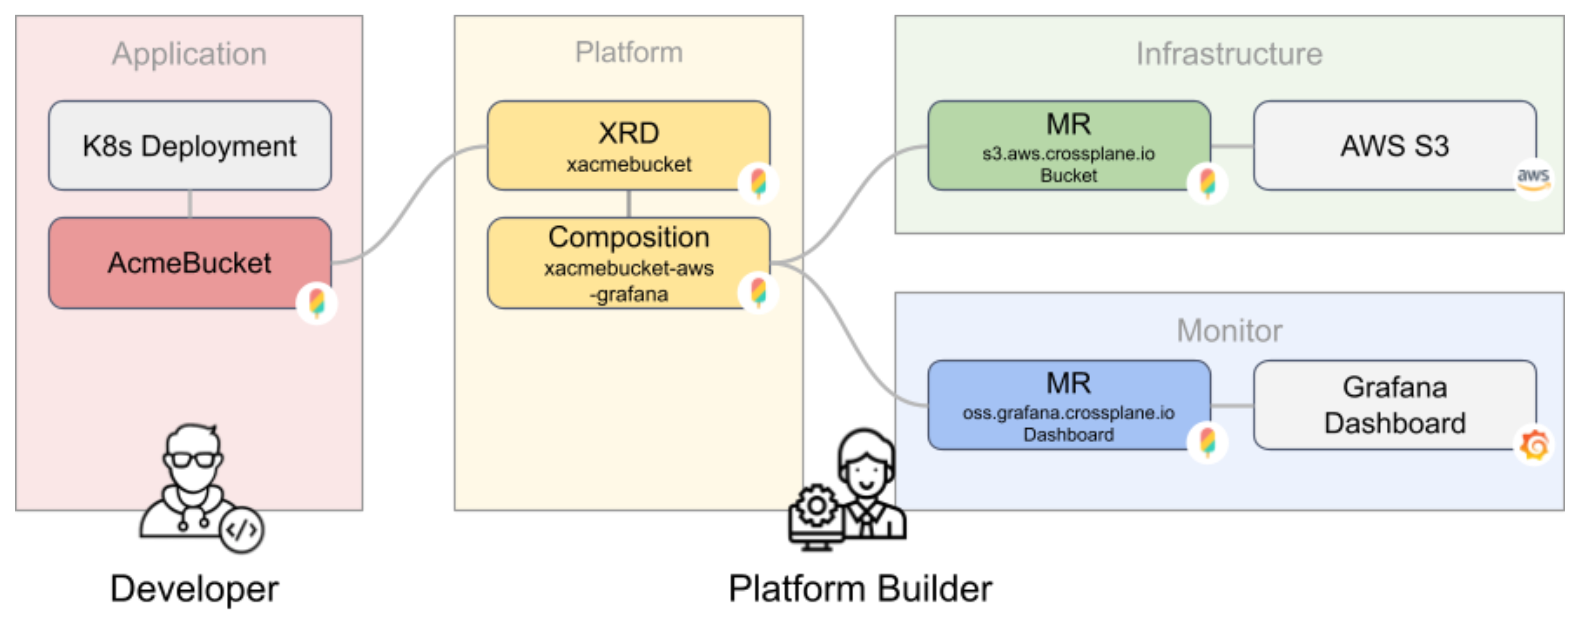
The Implementation
The platform team would now create the actual implementation. First they would create the storage bucket and restrict it to a certain region and second they would add a respective monitoring dashboard. In Crossplane terms we create a Composition consisting of two managed resources. The platform team can pick the backing vendor / API. In this example, I have chosen AWS S3 for the storage bucket and Grafana for the monitoring dashboard:
# apis/acmebuckets/composition.yaml
apiVersion: apiextensions.crossplane.io/v1
kind: Composition
metadata:
  name: xacmebuckets-aws-grafana
spec:
  compositeTypeRef:
    apiVersion: storage.example.com/v1alpha1
    kind: XAcmeBucket
  resources:
  - name: bucket
    base:
      apiVersion: s3.aws.crossplane.io/v1beta1
      kind: Bucket
      spec:
        forProvider:
          acl: public-read-write
          locationConstraint: us-east-1
    patches: ...
  - name: dashboard
    base:
      apiVersion: oss.grafana.crossplane.io/v1alpha1
      kind: Dashboard
      spec:
        spec:
          forProvider:
            configJson: |
              { // Grafana dashboard definition }
The Developer Experience
After the definition and the compositions are installed on a Crossplane cluster and the backing providers for AWS and Grafana are configured, developers can now provision new storage buckets and get a monitoring dashboard created without any additional specifications of how the monitoring should be setup:
# Create a custom acme-bucket:
$ kubectl create -n dev-space -f my-bucket.yaml
storage.example.com/acmebucket created

# Check all managed resources that the composition has created:
$ kubectl get managed
NAME                                          READY SYNCED AGE
bucket.s3.aws.crossplane.io/test-bucket-24496 True  True   43s
NAME                                          READY SYNCED AGE
dashboard.oss.grafana.crossplane.io/test-123  True  True   43s

# Get the URL of the Grafana dashboard:
$ kubectl get dashboard.oss.grafana.crossplane.io/test-123 -o yaml | yq .status.atProvider.url
https://random123.grafana.net/d/crossplane/crossplane-test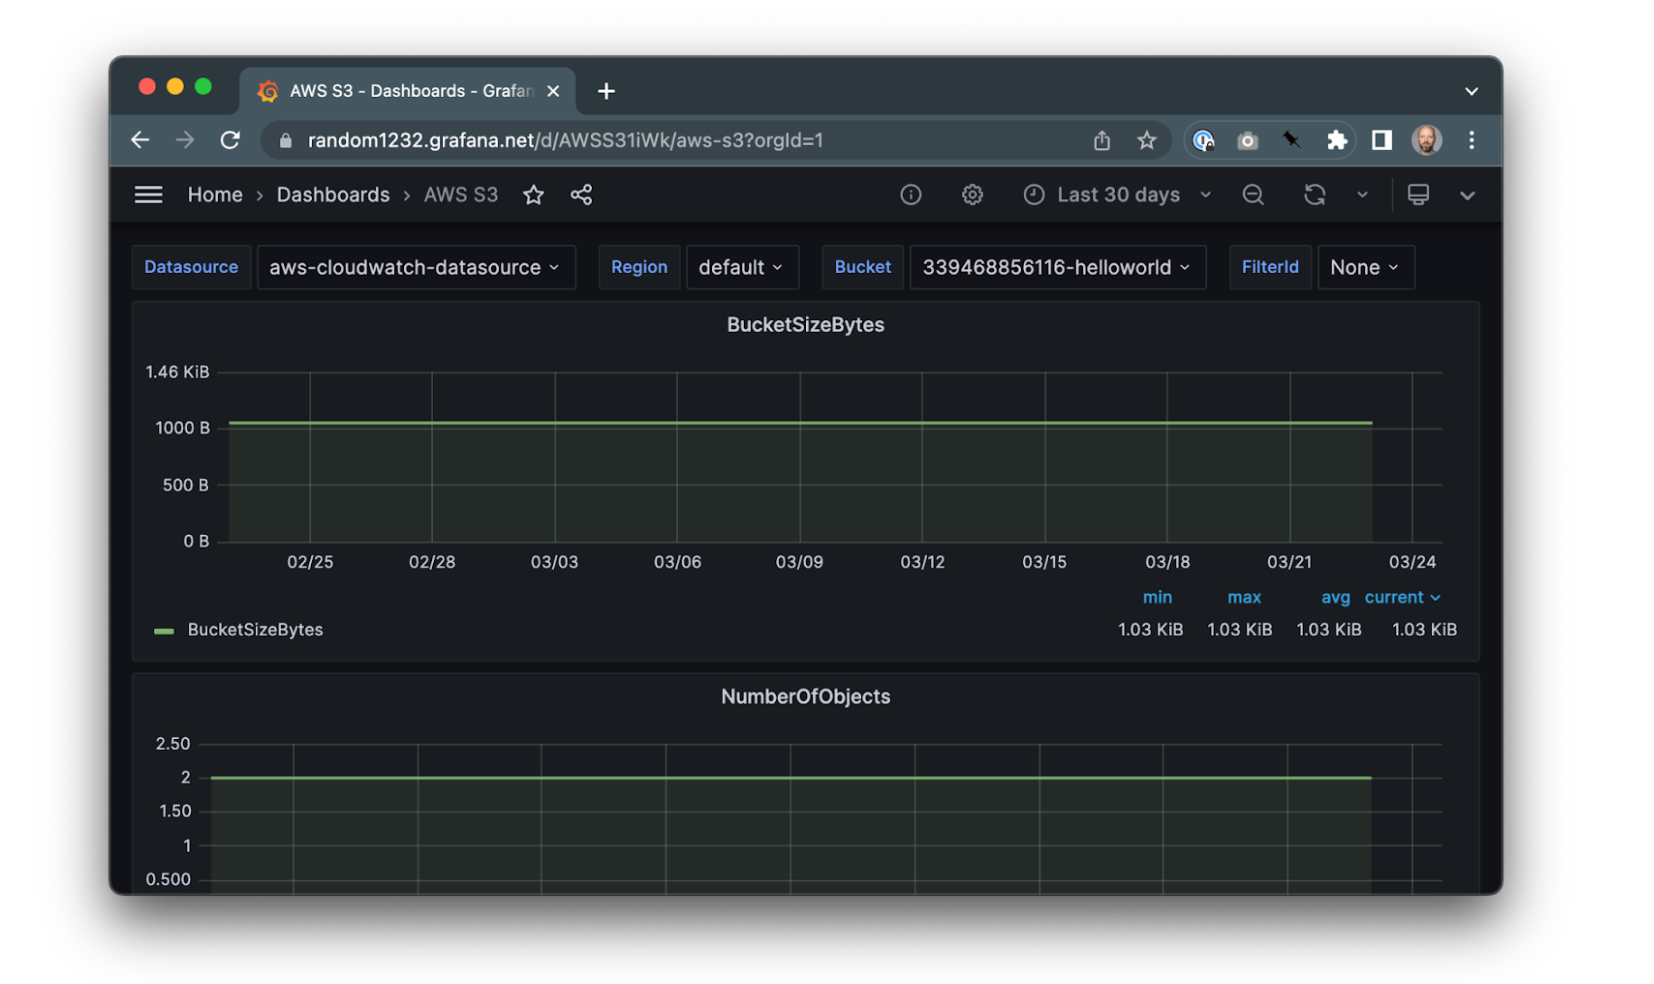
🎉
Conclusion & Next Steps
This is just the start of how we could think of building monitoring platforms with Crossplane. I hope I was able to convey the idea, and would love to start a broader discussion. Some immediate questions come to mind:
- How would we create alert definitions like Grafana’s RuleGroup or Datadog’s Monitor?
- How can we leverage nested compositions to further decouple ownership?
- What could be some standard schemas that we as a community could agree on?
- How would the setup differ for different personas?
Looking forward to hearing your thoughts. Please join slack.crossplane.io or this GitHub discussion and post your feedback, thoughts, and ideas. If you happen to be at KubeCon in Amsterdam this week, please reach out. You’ll find me at the Upbound booth. And join me at the TAG App Delivery booth on Wednesday at 3pm where I will present this idea in a lightning talk.